EELS: Acquisition and Analysis
This tutorial covers how to acquire EELS data using femtus.acquisition and analyze it using the eels package.
Package |
Import path |
Description |
|---|---|---|
|
Scan acquisition via FEMTUS |
|
|
Access acquired dataset |
|
|
EELS camera setup and analysis |
1from PyJEM import eels
2from PyJEM.femtus import acquisition
3from PyJEM.femtus import worksheet
Flow Overview
Section |
Description |
|---|---|
EELS SI Cube acquisition and analysis ( |
|
EELS line-scan acquisition and analysis ( |
SI Cube
Acquire using
femtus.acquisitionwithsetting['Region']['Shape'] = 'Rectangle'Generate whole spectrum:
eels.create_si_cube_whole_spectrumGet worksheet element:
worksheet.get_worksheet_elementGet image-content / graph-content
Apply calibration:
eels.set_calibration_result
Line
Acquire using
femtus.acquisitionwithsetting['Region']['Shape'] = 'Line'Generate whole spectrum:
eels.create_line_whole_spectrumGet worksheet element:
worksheet.get_worksheet_elementGet graph-content / graph-content
Apply calibration:
eels.set_calibration_result
SI Cube
Acquire EELS SI Cube (spectrum image) data using femtus.acquisition with Shape = 'Rectangle', then analyze using the eels package.
API reference: femtus.acquisition | eels
Acquisition
Configure the acquisition settings and start EELS SI Cube acquisition.
Set
setting['Detectors'] = ['Image', 'EELS']to enable both image and EELS detectors.Set
setting['Region']['Shape'] = 'Rectangle'for SI Cube (spectrum image) acquisition.
 1result = acquisition.get_settings()
 2if result["Settings"]:
 3    setting = result['Settings'][0]
 4else:
 5    setting = {
 6        'Detectors': [],
 7        'Region': {'Left': 0, 'Top': 0, 'Width': 32, 'Height': 32, 'Points': None, 'Shape': 'Rectangle'},
 8        'Conditions': {'DwellTime': 100, 'PixelResolution': 1, 'IsPlayback': False,
 9                       'CollectionMode': {'Mode': 'Sweep', 'Count': 1}},
10        'DriftCorrection': {'Type': 'None', 'Interval': 1, 'CorrectionRegion': None}
11    }
12
13# Select detectors
14setting['Detectors'] = ['Image', 'EELS']
15
16# Set acquisition region for SI Cube
17setting['Region']['Shape'] = 'Rectangle'
18setting['Region']['Width'] = 32
19setting['Region']['Height'] = 32
20
21# Set acquisition conditions
22setting['Conditions']['DwellTime'] = 100              # microseconds
23setting['Conditions']['CollectionMode']['Mode'] = 'Sweep'
24setting['Conditions']['CollectionMode']['Count'] = 1
25
26setting
{'Id': '08274fde-dd82-44c0-906c-d045552c6a43',
 'Detectors': ['Image', 'EELS'],
 'Region': {'Left': 229,
  'Top': 206,
  'Width': 32,
  'Height': 32,
  'Points': None,
  'Shape': 'Rectangle'},
 'Conditions': {'DwellTime': 100,
  'PixelResolution': 1,
  'IsPlayback': False,
  'CollectionMode': {'Mode': 'Sweep', 'Count': 1}},
 'DriftCorrection': {'Type': 'None', 'Interval': 1, 'CorrectionRegion': None}}
1start_result = acquisition.start(setting)
2acquisition_id = start_result['AcquisitionID']
3start_result
{'AcquisitionID': '6b81ab09-a1c9-4bf3-bc7a-c454369354e3',
 'WorksheetID': '6d33305e-8d86-4867-917f-7d959c3398bb',
 'ReferenceDetector': 'VP_ADF_1',
 'Version': '1.0.0'}
1acquisition_result = acquisition.get_acquisition_result(acquisition_id)
2
3for r in acquisition_result['Results']:
4    print(r['DataType'], '->', r['Id'])
5    if r['DataType'] == 'EELS_Cube':
6        eels_cube_id = r['Id']
STEM_Survey -> 2c63baa5-1c41-4aea-81a2-b186d35595fa
STEM_HAADF_SeleArea -> 4eb6b93b-149f-4225-9e09-b5b2f211a24e
EELS_Cube -> 9ca464f7-5e58-4fc5-b42a-9b5fe7a5221a
{'Results': [{'Id': '2c63baa5-1c41-4aea-81a2-b186d35595fa',
   'DataType': 'STEM_Survey'},
  {'Id': '4eb6b93b-149f-4225-9e09-b5b2f211a24e',
   'DataType': 'STEM_HAADF_SeleArea'},
  {'Id': '9ca464f7-5e58-4fc5-b42a-9b5fe7a5221a', 'DataType': 'EELS_Cube'}]}
SI Cube Analysis
The following cells analyze the acquired SI Cube dataset using the eels package.
The following example outlines the procedure for analyzing and outputting the results of the whole spectrum.
eels.create_si_cube_whole_spectrum
Generate a whole-area integrated spectrum from the SI Cube dataset.
The returned object contains an Ids list with IDs for the generated datasets (image content and graph content).
1whole_spectrum = eels.create_si_cube_whole_spectrum(eels_cube_id)
2whole_spectrum
worksheet.get_worksheet_element
create_si_cube_whole_spectrum returns a dict with an Ids list containing two entries:
Index |
ContentType |
Description |
|---|---|---|
0 |
|
Retrieved via |
1 |
|
Retrieved via |
Use get_worksheet_element to retrieve each dataset by its Id.
1for id in whole_spectrum['Ids']:
2    element = worksheet.get_worksheet_element(id)
3    print(element['ContentSummary']['ContentType'], '->', element['Id'])
ImageContent -> ec2b3897-8040-4dd8-8dff-9b2cb61bf72f
GraphContent -> c283a2b5-7252-4827-ac5c-950624a5c072
ImageContent and GraphContent
Retrieve the image content (Ids[0]) and graph content (Ids[1]) from the worksheet elements.
1# Ids[0]: ImageContent — retrieve with get_image_content
2element = worksheet.get_worksheet_element(whole_spectrum['Ids'][0])
3image_content = worksheet.get_image_content(element['ContentSummary']['Id'])
4image_content
{'Id': '49858513-675f-48a5-af1d-8501e4e453d8',
 'Children': [{'Id': '1734b7c3-dec5-4e1a-b223-5118d3f40187',
   'IsSelected': False,
   'Clump': {'Id': '001eb99e-db3a-4668-9ee6-dd875e1e6231',
    'Information': {'Header': {'Version': '1.0.0',
      'ClumpId': '001eb99e-db3a-4668-9ee6-dd875e1e6231',
      'DataType': 'EELS_Cube',
      'DataSubType': '',
      'DetectorType': 1,
      'ClumpType': 'Clump',
      'Name': 'Cube'},
     'DataInformation': {'TypeInfo': 2,
      'DataBytes': 4,
      'Channel': 1,
      'DimensionLength': 3,
      'Dimensions': [32, 32, 512],
      'ChannelType': 'GrayScale',
      'IsRangeFixed': False,
      'MinimumPossibleIntensity': -1.7976931348623157e+308,
      'MaximumPossibleIntensity': 1.7976931348623157e+308},
     'MeasurementInformation': {'CalibrationCoefficients': [{'Scale': 14.6875,
        'Offset': 0,
        'Unit': 'Nanometer'},
       {'Scale': 14.697265625, 'Offset': 0, 'Unit': 'Nanometer'},
       {'Scale': 2, 'Offset': 0, 'Unit': 'Nanometer'}]},
     'Tags': {'General': {'Instrument': 'JEM-ARM200F',
       'Manufacturer': 'JEOL Ltd.',
       'Comment': '',
       'DateTime': '20260402153944435',
       'ProductName': 'FEMTUS',
       'ProductVersion': '2.0.0.0+8cc42b3fb348c2458c76e358a38bce3fb5cd1063',
       'UpdateDateTime': '20260402153944435',
       'UpdateProductName': 'FEMTUS',
       'UpdateProductVersion': '2.0.0.0+8cc42b3fb348c2458c76e358a38bce3fb5cd1063',
       'AnalysisId': '75f87d81-1242-418e-9d6e-eda2d7417f83',
       'AnalysisDateTime': '20260402153943687',
       'AcquisitionId': 'af9842a2-ec66-476d-9173-79dd2cbec977',
       'AcquisitionDateTime': '20260402153943687'},
      'EELS': {'FilterMode': 'STEM-EELS',
       'FilterSubmode': 'align',
       'DataType': 'Image',
       'Dispersion': 0,
       'CameraLengthCoefficient': 1,
       'MagnificationValue': 1,
       'EnergyLossOffset': 0,
       'DriftTubeVoltage': 0,
       'HighTensionOffset': 0,
       'SectorOffset': 0,
       'SlitMode': 'Out',
       'SlitInserted': False,
       'SlitWidth': 0,
       'EntranceApertureHoleString': 'Out',
       'EntranceApertureInserted': False},
      'ScanGenerator': {},
      'HT': {'GunType': 'Cfeg',
       'AccelerationVoltage': 200000,
       'EnergyShift': 0},
      'EOS': {'OperationMode': 'Scanning',
       'SpotSizeNumber': 0,
       'ConvergenceAngleAlphaNumber': 0,
       'ImageFormingMode': 'MAG',
       'RockingAngle': 0,
       'MagnificationValue': 20000,
       'MagnificationString': 'x20k',
       'CameraLength': 15,
       'CameraLengthString': '1.5cm'},
      'Stage': {'X': {'Position': 0},
       'Y': {'Position': 0},
       'Z': {'Position': 0},
       'TX': {'Position': 0},
       'TY': {'Position': 0},
       'TZ': {'Position': 0},
       'PX': {'Position': 0},
       'PY': {'Position': 0},
       'PZ': {'Position': 0}},
      'Aperture': {'CL': {'ApertureHoleString': '0'},
       'CL2': {'ApertureHoleString': '0'},
       'OL': {'ApertureHoleString': '0'},
       'SA': {'ApertureHoleString': '0'}},
      'Detector': {'DetectorKind': 'Test Camera Name 0',
       'Manufacturer': 'Test Vendor',
       'ModelCode': 'Test Camera Name 0',
       'ModelDisplayName': 'Test Camera Name 0',
       'PixelsPerMeter': {'Horizontal': 200000, 'Vertical': 200000},
       'ImagingArea': {'X': 256, 'Y': 128, 'Width': 512, 'Height': 512},
       'BinningSize': {'X': 2, 'Y': 2},
       'SoftwareCroppingArea': {'X': 0, 'Y': 0, 'Width': 512, 'Height': 512},
       'SoftwareBinningSize': {'X': 1, 'Y': 1},
       'ExposureTimeValue': 100,
       'FrameIntegration': 1}}},
    'ViewInformation': {'Header': {'Version': '2.0.0',
      'ClumpId': '001eb99e-db3a-4668-9ee6-dd875e1e6231'},
     'Tags': {}}}}]}
1# Ids[1]: GraphContent — retrieve with get_graph_content
2element = worksheet.get_worksheet_element(whole_spectrum['Ids'][1])
3graph_content = worksheet.get_graph_content(element['ContentSummary']['Id'])
4graph_content
{'Id': '68a11875-7cd3-41c0-9d4c-947d18603ada',
 'Children': [{'Id': '80f1c410-8884-46e6-bd54-1e668764ae94',
   'IsSelected': False,
   'Clump': {'Id': '744b96a9-914e-4aea-abd3-464ac6b4d7a9',
    'Information': {'Header': {'Version': '1.0.0',
      'ClumpId': '744b96a9-914e-4aea-abd3-464ac6b4d7a9',
      'DataType': 'EELS_Cube_Spectrum',
      'DataSubType': '',
      'DetectorType': 1,
      'ClumpType': 'Clump',
      'Name': 'Spectrum'},
     'DataInformation': {'TypeInfo': 2,
      'DataBytes': 8,
      'Channel': 1,
      'DimensionLength': 1,
      'Dimensions': [512],
      'ChannelType': 'GrayScale',
      'IsRangeFixed': False,
      'MinimumPossibleIntensity': -1.7976931348623157e+308,
      'MaximumPossibleIntensity': 1.7976931348623157e+308},
     'MeasurementInformation': {'CalibrationCoefficients': [{'Scale': 2,
        'Offset': 0,
        'Unit': 'eV'}]},
     'Tags': {'General': {'Instrument': 'JEM-ARM200F',
       'Manufacturer': 'JEOL Ltd.',
       'Comment': '',
       'DateTime': '20260402153944435',
       'ProductName': 'FEMTUS',
       'ProductVersion': '2.0.0.0+8cc42b3fb348c2458c76e358a38bce3fb5cd1063',
       'UpdateDateTime': '20260402153944435',
       'UpdateProductName': 'FEMTUS',
       'UpdateProductVersion': '2.0.0.0+8cc42b3fb348c2458c76e358a38bce3fb5cd1063',
       'AnalysisId': '2e127b69-0af7-4f1c-8051-e223dcd35342',
       'AnalysisDateTime': '20260402164653468',
       'AcquisitionId': 'af9842a2-ec66-476d-9173-79dd2cbec977',
       'AcquisitionDateTime': '20260402153943687'},
      'EELS': {'FilterMode': 'STEM-EELS',
       'FilterSubmode': 'align',
       'DataType': 'Image',
       'Dispersion': 0,
       'CameraLengthCoefficient': 1,
       'MagnificationValue': 1,
       'EnergyLossOffset': 0,
       'DriftTubeVoltage': 0,
       'HighTensionOffset': 0,
       'SectorOffset': 0,
       'SlitMode': 'Out',
       'SlitInserted': False,
       'SlitWidth': 0,
       'EntranceApertureHoleString': 'Out',
       'EntranceApertureInserted': False},
      'ScanGenerator': {},
      'HT': {'GunType': 'Cfeg',
       'AccelerationVoltage': 200000,
       'EnergyShift': 0},
      'EOS': {'OperationMode': 'Scanning',
       'SpotSizeNumber': 0,
       'ConvergenceAngleAlphaNumber': 0,
       'ImageFormingMode': 'MAG',
       'RockingAngle': 0,
       'MagnificationValue': 20000,
       'MagnificationString': 'x20k',
       'CameraLength': 15,
       'CameraLengthString': '1.5cm'},
      'Stage': {'X': {'Position': 0},
       'Y': {'Position': 0},
       'Z': {'Position': 0},
       'TX': {'Position': 0},
       'TY': {'Position': 0},
       'TZ': {'Position': 0},
       'PX': {'Position': 0},
       'PY': {'Position': 0},
       'PZ': {'Position': 0}},
      'Aperture': {'CL': {'ApertureHoleString': '0'},
       'CL2': {'ApertureHoleString': '0'},
       'OL': {'ApertureHoleString': '0'},
       'SA': {'ApertureHoleString': '0'}},
      'Detector': {'DetectorKind': 'Test Camera Name 0',
       'Manufacturer': 'Test Vendor',
       'ModelCode': 'Test Camera Name 0',
       'ModelDisplayName': 'Test Camera Name 0',
       'PixelsPerMeter': {'Horizontal': 200000, 'Vertical': 200000},
       'ImagingArea': {'X': 256, 'Y': 128, 'Width': 512, 'Height': 512},
       'BinningSize': {'X': 2, 'Y': 2},
       'SoftwareCroppingArea': {'X': 0, 'Y': 0, 'Width': 512, 'Height': 512},
       'SoftwareBinningSize': {'X': 1, 'Y': 1},
       'ExposureTimeValue': 100,
       'FrameIntegration': 1},
      'Processings': [{'Parents': ['001eb99e-db3a-4668-9ee6-dd875e1e6231'],
        'ProcessType': 'ExtractSpectrum',
        'Parameters': [{'ExtractRoi': {'ShapeType': 'Rectangle',
           'Shape': {'X': 0, 'Y': 0, 'Width': 32, 'Height': 32}}}]}]}},
    'ViewInformation': {'Header': {'Version': '2.0.0',
      'ClumpId': '744b96a9-914e-4aea-abd3-464ac6b4d7a9'},
     'Tags': {}}}},
  {'Id': '7a4a064c-4df0-4dda-8d52-c56090f3a1bf',
   'IsSelected': False,
   'Clump': {'Id': '63d2b3a0-db89-433c-9430-4b1ed550d39e',
    'Information': {'Header': {'Version': '1.0.0',
      'ClumpId': '63d2b3a0-db89-433c-9430-4b1ed550d39e',
      'DataType': 'EELS_Cube_Spectrum',
      'DataSubType': '',
      'DetectorType': 0,
      'ClumpType': 'Clump',
      'Name': 'H-K Background'},
     'DataInformation': {'TypeInfo': 2,
      'DataBytes': 8,
      'Channel': 1,
      'DimensionLength': 1,
      'Dimensions': [30],
      'ChannelType': '',
      'IsRangeFixed': False,
      'MinimumPossibleIntensity': -1.7976931348623157e+308,
      'MaximumPossibleIntensity': 1.7976931348623157e+308},
     'MeasurementInformation': {'CalibrationCoefficients': [{'Scale': 2,
        'Offset': 0,
        'Unit': 'eV'}]},
     'Tags': {'General': {'AnalysisId': '9d7668b6-bbee-4789-9e10-3eab1346a470',
       'AnalysisDateTime': '20260402171632000'}}},
    'ViewInformation': {'Header': {'Version': '2.0.0',
      'ClumpId': '63d2b3a0-db89-433c-9430-4b1ed550d39e'},
     'Tags': {'ImagePseudoColor': {'PseudoColor': {'ColorType': 'SINGLECOLOR',
        'R': 0,
        'G': 255,
        'B': 255}}}}}},
  {'Id': '4829260f-2d8d-46ed-8701-3d876ccb1d20',
   'IsSelected': False,
   'Clump': {'Id': '3b7d85d1-52aa-4413-9ddd-4b3fc0238d0d',
    'Information': {'Header': {'Version': '1.0.0',
      'ClumpId': '3b7d85d1-52aa-4413-9ddd-4b3fc0238d0d',
      'DataType': 'EELS_Cube_Spectrum',
      'DataSubType': '',
      'DetectorType': 0,
      'ClumpType': 'Clump',
      'Name': 'H-K Signal'},
     'DataInformation': {'TypeInfo': 2,
      'DataBytes': 8,
      'Channel': 1,
      'DimensionLength': 1,
      'Dimensions': [30],
      'ChannelType': '',
      'IsRangeFixed': False,
      'MinimumPossibleIntensity': -1.7976931348623157e+308,
      'MaximumPossibleIntensity': 1.7976931348623157e+308},
     'MeasurementInformation': {'CalibrationCoefficients': [{'Scale': 2,
        'Offset': 0,
        'Unit': 'eV'}]},
     'Tags': {'General': {'AnalysisId': '79dfcdc3-758d-4069-993d-036f26bc9e9a',
       'AnalysisDateTime': '20260402171632001'}}},
    'ViewInformation': {'Header': {'Version': '2.0.0',
      'ClumpId': '3b7d85d1-52aa-4413-9ddd-4b3fc0238d0d'},
     'Tags': {'ImagePseudoColor': {'PseudoColor': {'ColorType': 'SINGLECOLOR',
        'R': 255,
        'G': 0,
        'B': 0}}}}}}]}
worksheet.get_clump_num_array_accessor
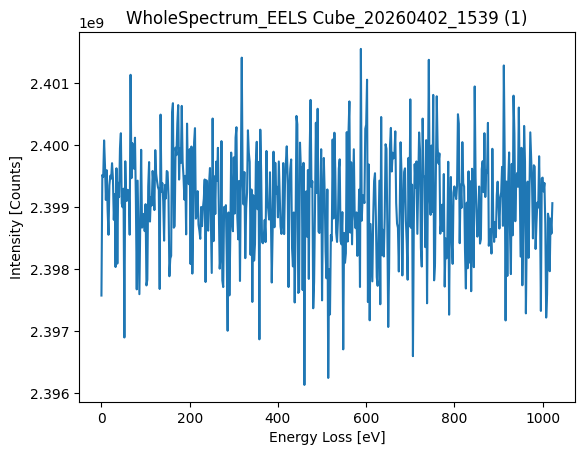
The following cell generates a spectrum plot from graph_content (spectrum data) using these steps:
Retrieve the
ClumpIdviaget_data_setRetrieve
Dimensions/ElementTypeviaget_clump_num_arrayRetrieve the energy-axis
Offset/Scale/UnitfromMeasurementInformation.CalibrationCoefficientsRetrieve the raw byte array via
get_clump_num_array_accessor, inferdtypefrom the byte count, and convert to a numpy arrayBuild the energy axis (
Energy Loss [eV]) and plot the spectrum withplt.plot
 1import numpy as np
 2import matplotlib.pyplot as plt
 3
 4# Get ClumpId from graph_content Children via get_data_set
 5dataset = worksheet.get_data_set(graph_content['Children'][0]['Id'])
 6clump_id = dataset['Clump']['Id']
 7
 8# Get array dimensions and element type
 9array_info = worksheet.get_clump_num_array(clump_id)
10print('Dimensions:', array_info['Dimensions'])
11print('ElementType:', array_info['ElementType'])
12
13# Get calibration coefficients for energy axis
14calib = dataset['Clump']['Information']['MeasurementInformation']['CalibrationCoefficients'][0]
15offset = calib['Offset']
16scale = calib['Scale']
17unit_map = {'ElectronVolt': 'eV', 'Millielectronvolt': 'meV',
18            'Nanometer': 'nm', 'Angstrom': 'Å', 'Meter': 'm'}
19unit = unit_map.get(calib['Unit'], calib['Unit'])
20print(f"Calibration: offset={offset}, scale={scale}, unit={calib['Unit']}")
21
22# Get raw byte array and infer dtype from byte count
23raw_bytes = worksheet.get_clump_num_array_accessor(clump_id)
24total_elements = 1
25for d in array_info['Dimensions']:
26    total_elements *= d
27bytes_per_element = len(raw_bytes) // total_elements
28dtype_map = {1: np.uint8, 2: np.uint16, 4: np.float32, 8: np.float64}
29dtype = dtype_map.get(bytes_per_element, np.float32)
30narray = np.frombuffer(raw_bytes, dtype=dtype).reshape(array_info['Dimensions'])
31print('dtype:', dtype, '  shape:', narray.shape)
32
33# Build energy axis and plot spectrum
34spectrum = narray.ravel()
35energy_axis = offset + scale * np.arange(len(spectrum))
36
37plt.figure()
38plt.plot(energy_axis, spectrum)
39plt.xlabel(f'Energy Loss [{unit}]')
40plt.ylabel('Intensity [Counts]')
41plt.title(element['Title'])
42plt.show()
Dimensions: [1, 512]
ElementType: Double
Calibration: offset=0, scale=2, unit=eV
dtype: <class 'numpy.float64'>   shape: (1, 512)
eels.set_calibration_result
Apply energy-axis calibration to the spectrum dataset (graph content).
Specify the dispersion and the first/second energy loss values in eV.
1calibration_param = {
2    'Dispersion': 2,
3    'FirstEnergyLoss': -512,
4    'SecondEnergyLoss': 510
5}
6eels.set_calibration_result(graph_content['Children'][0]['Id'], calibration_param)
Line
Acquire EELS line-scan data using femtus.acquisition with Shape = 'Line', then analyze using the eels package.
API reference: femtus.acquisition | eels
Acquisition
Configure the acquisition settings and start EELS line-scan acquisition.
Set
setting['Detectors'] = ['Image', 'EELS']to enable both image and EELS detectors.Set
setting['Region']['Shape'] = 'Line'for line-scan acquisition.
 1result = acquisition.get_settings()
 2if result["Settings"]:
 3    setting = result['Settings'][0]
 4else:
 5    setting = {
 6        'Detectors': [],
 7        'Region': {'Left': 0, 'Top': 0, 'Width': 32, 'Height': 1, 'Points': None, 'Shape': 'Line'},
 8        'Conditions': {'DwellTime': 100, 'PixelResolution': 1, 'IsPlayback': False,
 9                       'CollectionMode': {'Mode': 'Sweep', 'Count': 1}},
10        'DriftCorrection': {'Type': 'None', 'Interval': 1, 'CorrectionRegion': None}
11    }
12
13# Select detectors
14setting['Detectors'] = ['Image', 'EELS']
15
16# Set acquisition region for line scan
17setting['Region']['Shape'] = 'Line'
18setting['Region']['Width'] = 32
19setting['Region']['Height'] = 1
20
21# Set acquisition conditions
22setting['Conditions']['DwellTime'] = 100              # microseconds
23setting['Conditions']['CollectionMode']['Mode'] = 'Sweep'
24setting['Conditions']['CollectionMode']['Count'] = 1
25
26setting
{'Id': 'dd37ad22-765a-4df9-94dc-7c27bba80cd5',
 'Detectors': ['Image', 'EELS'],
 'Region': {'Left': 320,
  'Top': 257,
  'Width': 32,
  'Height': 1,
  'Points': None,
  'Shape': 'Line'},
 'Conditions': {'DwellTime': 100,
  'PixelResolution': 1,
  'IsPlayback': False,
  'CollectionMode': {'Mode': 'Sweep', 'Count': 1}},
 'DriftCorrection': {'Type': 'None', 'Interval': 1, 'CorrectionRegion': None}}
1start_result = acquisition.start(setting)
2acquisition_id = start_result['AcquisitionID']
3print('AcquisitionID:', acquisition_id)
4start_result
AcquisitionID: 48c95a79-0d84-4846-a16b-3132969b78ba
{'AcquisitionID': '48c95a79-0d84-4846-a16b-3132969b78ba',
 'WorksheetID': '6d33305e-8d86-4867-917f-7d959c3398bb',
 'ReferenceDetector': 'VP_ADF_1',
 'Version': '1.0.0'}
1acquisition_result = acquisition.get_acquisition_result(acquisition_id)
2
3for r in acquisition_result['Results']:
4    print(r['DataType'], '->', r['Id'])
5    if r['DataType'] == 'EELS_Line':
6        eels_line_id = r['Id']
7
8acquisition_result
STEM_Survey -> 4620d2a7-077c-4673-84c7-25f2ad6eedca
STEM_HAADF_SeleArea -> e4a35256-447a-4047-97f8-822e493777a8
EELS_Line -> d9247652-eb4b-44e1-96b2-2fbea49cd2d7
{'Results': [{'Id': '4620d2a7-077c-4673-84c7-25f2ad6eedca',
   'DataType': 'STEM_Survey'},
  {'Id': 'e4a35256-447a-4047-97f8-822e493777a8',
   'DataType': 'STEM_HAADF_SeleArea'},
  {'Id': 'd9247652-eb4b-44e1-96b2-2fbea49cd2d7', 'DataType': 'EELS_Line'}]}
Line Analysis
The following cells analyze the acquired line-scan dataset using the eels package.
eels.create_line_whole_spectrum
Generate a whole-range integrated spectrum from the line-scan dataset.
The returned object contains an Ids list with IDs for the generated datasets (image content and graph content).
1whole_spectrum = eels.create_line_whole_spectrum(eels_line_id)
2whole_spectrum
{'Ids': ['80051f5e-2480-4612-ae21-b1f9e2c1957a',
  'f54e6008-d36e-4f9a-a2ce-377fa9848b76']}
1for id in whole_spectrum['Ids']:
2    element = worksheet.get_worksheet_element(id)
3    print(element['ContentSummary']['ContentType'], '->', element['Id'])
GraphContent -> 80051f5e-2480-4612-ae21-b1f9e2c1957a
GraphContent -> f54e6008-d36e-4f9a-a2ce-377fa9848b76
ImageContent and GraphContent
Retrieve the graph content (Ids[0], Ids[1]) from the worksheet elements.
worksheet.get_worksheet_element
create_line_whole_spectrum returns a dict with an Ids list containing two entries:
Index |
ContentType |
Description |
|---|---|---|
0 |
|
Retrieved via |
1 |
|
Retrieved via |
Use get_worksheet_element to retrieve each dataset by its Id.
1# Ids[0]: GraphContent — retrieve with get_image_content
2element = worksheet.get_worksheet_element(whole_spectrum['Ids'][0])
3graph_content1 = worksheet.get_graph_content(element['ContentSummary']['Id'])
4graph_content1
{'Id': '020cf41c-4e26-4f0c-9fde-e7f907cc9802',
 'Children': [{'Id': 'd9247652-eb4b-44e1-96b2-2fbea49cd2d7',
   'IsSelected': False,
   'Clump': {'Id': '770ae6e5-119e-43e6-9430-54e26af2e1ca',
    'Information': {'Header': {'Version': '1.0.0',
      'ClumpId': '770ae6e5-119e-43e6-9430-54e26af2e1ca',
      'DataType': 'EELS_Line',
      'DataSubType': '',
      'DetectorType': 1,
      'ClumpType': 'Clump',
      'Name': 'Line'},
     'DataInformation': {'TypeInfo': 2,
      'DataBytes': 4,
      'Channel': 1,
      'DimensionLength': 2,
      'Dimensions': [33, 512],
      'ChannelType': 'GrayScale',
      'IsRangeFixed': False,
      'MinimumPossibleIntensity': -1.7976931348623157e+308,
      'MaximumPossibleIntensity': 1.7976931348623157e+308},
     'MeasurementInformation': {'CalibrationCoefficients': [{'Scale': 44.2212586825585,
        'Offset': 0,
        'Unit': 'Nanometer'},
       {'Scale': 200000, 'Offset': 0, 'Unit': 'Nanometer'}]},
     'Tags': {'General': {'Instrument': 'JEM-ARM200F',
       'Manufacturer': 'JEOL Ltd.',
       'Comment': '',
       'DateTime': '20260403141159941',
       'ProductName': 'FEMTUS',
       'ProductVersion': '2.0.0.0+8cc42b3fb348c2458c76e358a38bce3fb5cd1063',
       'UpdateDateTime': '20260403141159941',
       'UpdateProductName': 'FEMTUS',
       'UpdateProductVersion': '2.0.0.0+8cc42b3fb348c2458c76e358a38bce3fb5cd1063',
       'AnalysisId': 'caa769a6-f67d-48a8-b6f2-57df48977f67',
       'AnalysisDateTime': '20260403141158914',
       'AcquisitionId': '48c95a79-0d84-4846-a16b-3132969b78ba',
       'AcquisitionDateTime': '20260403141158914'},
      'EELS': {'FilterMode': 'STEM-EELS',
       'FilterSubmode': 'align',
       'DataType': 'Image',
       'Dispersion': 0,
       'CameraLengthCoefficient': 1,
       'MagnificationValue': 1,
       'EnergyLossOffset': 0,
       'DriftTubeVoltage': 0,
       'HighTensionOffset': 0,
       'SectorOffset': 0,
       'SlitMode': 'Out',
       'SlitInserted': False,
       'SlitWidth': 0,
       'EntranceApertureHoleString': 'Out',
       'EntranceApertureInserted': False},
      'ScanGenerator': {},
      'HT': {'GunType': 'Cfeg',
       'AccelerationVoltage': 200000,
       'EnergyShift': 0},
      'EOS': {'OperationMode': 'Scanning',
       'SpotSizeNumber': 0,
       'ConvergenceAngleAlphaNumber': 0,
       'ImageFormingMode': 'MAG',
       'RockingAngle': 0,
       'MagnificationValue': 20000,
       'MagnificationString': 'x20k',
       'CameraLength': 15,
       'CameraLengthString': '1.5cm'},
      'Stage': {'X': {'Position': 0},
       'Y': {'Position': 0},
       'Z': {'Position': 0},
       'TX': {'Position': 0},
       'TY': {'Position': 0},
       'TZ': {'Position': 0},
       'PX': {'Position': 0},
       'PY': {'Position': 0},
       'PZ': {'Position': 0}},
      'Aperture': {'CL': {'ApertureHoleString': '0'},
       'CL2': {'ApertureHoleString': '0'},
       'OL': {'ApertureHoleString': '0'},
       'SA': {'ApertureHoleString': '0'}},
      'Detector': {'DetectorKind': 'Test Camera Name 0',
       'Manufacturer': 'Test Vendor',
       'ModelCode': 'Test Camera Name 0',
       'ModelDisplayName': 'Test Camera Name 0',
       'PixelsPerMeter': {'Horizontal': 200000, 'Vertical': 200000},
       'ImagingArea': {'X': 256, 'Y': 128, 'Width': 512, 'Height': 512},
       'BinningSize': {'X': 2, 'Y': 2},
       'SoftwareCroppingArea': {'X': 0, 'Y': 0, 'Width': 512, 'Height': 512},
       'SoftwareBinningSize': {'X': 1, 'Y': 1},
       'ExposureTimeValue': 100,
       'FrameIntegration': 1},
      'ScanDataAcquisition': {'AcquiredFrames': 1}}},
    'ViewInformation': {'Header': {'Version': '2.0.0',
      'ClumpId': '770ae6e5-119e-43e6-9430-54e26af2e1ca'},
     'Tags': {'GraphDisplay': {'IsLegendAreaVisible': True}}}}}]}
1# Ids[1]: GraphContent — retrieve with get_graph_content
2element = worksheet.get_worksheet_element(whole_spectrum['Ids'][1])
3graph_content2 = worksheet.get_graph_content(element['ContentSummary']['Id'])
4graph_content2
{'Id': '7ff78347-0ee0-4829-9c88-22a4b119b375',
 'Children': [{'Id': '2ac3a4c6-9c76-412b-92f0-0180a2a40b28',
   'IsSelected': False,
   'Clump': {'Id': '092084a4-e896-4118-bea5-90082f91a1d5',
    'Information': {'Header': {'Version': '1.0.0',
      'ClumpId': '092084a4-e896-4118-bea5-90082f91a1d5',
      'DataType': 'EELS_Line_Spectrum',
      'DataSubType': '',
      'DetectorType': 1,
      'ClumpType': 'Clump',
      'Name': 'Spectrum'},
     'DataInformation': {'TypeInfo': 2,
      'DataBytes': 8,
      'Channel': 1,
      'DimensionLength': 1,
      'Dimensions': [512],
      'ChannelType': 'GrayScale',
      'IsRangeFixed': False,
      'MinimumPossibleIntensity': -1.7976931348623157e+308,
      'MaximumPossibleIntensity': 1.7976931348623157e+308},
     'MeasurementInformation': {'CalibrationCoefficients': [{'Scale': 200000,
        'Offset': 0,
        'Unit': 'eV'}]},
     'Tags': {'General': {'Instrument': 'JEM-ARM200F',
       'Manufacturer': 'JEOL Ltd.',
       'Comment': '',
       'DateTime': '20260403141159941',
       'ProductName': 'FEMTUS',
       'ProductVersion': '2.0.0.0+8cc42b3fb348c2458c76e358a38bce3fb5cd1063',
       'UpdateDateTime': '20260403141159941',
       'UpdateProductName': 'FEMTUS',
       'UpdateProductVersion': '2.0.0.0+8cc42b3fb348c2458c76e358a38bce3fb5cd1063',
       'AnalysisId': '718d54b6-52b4-4849-8fe9-47d78b53f770',
       'AnalysisDateTime': '20260403141213159',
       'AcquisitionId': '48c95a79-0d84-4846-a16b-3132969b78ba',
       'AcquisitionDateTime': '20260403141158914'},
      'EELS': {'FilterMode': 'STEM-EELS',
       'FilterSubmode': 'align',
       'DataType': 'Image',
       'Dispersion': 0,
       'CameraLengthCoefficient': 1,
       'MagnificationValue': 1,
       'EnergyLossOffset': 0,
       'DriftTubeVoltage': 0,
       'HighTensionOffset': 0,
       'SectorOffset': 0,
       'SlitMode': 'Out',
       'SlitInserted': False,
       'SlitWidth': 0,
       'EntranceApertureHoleString': 'Out',
       'EntranceApertureInserted': False},
      'ScanGenerator': {},
      'HT': {'GunType': 'Cfeg',
       'AccelerationVoltage': 200000,
       'EnergyShift': 0},
      'EOS': {'OperationMode': 'Scanning',
       'SpotSizeNumber': 0,
       'ConvergenceAngleAlphaNumber': 0,
       'ImageFormingMode': 'MAG',
       'RockingAngle': 0,
       'MagnificationValue': 20000,
       'MagnificationString': 'x20k',
       'CameraLength': 15,
       'CameraLengthString': '1.5cm'},
      'Stage': {'X': {'Position': 0},
       'Y': {'Position': 0},
       'Z': {'Position': 0},
       'TX': {'Position': 0},
       'TY': {'Position': 0},
       'TZ': {'Position': 0},
       'PX': {'Position': 0},
       'PY': {'Position': 0},
       'PZ': {'Position': 0}},
      'Aperture': {'CL': {'ApertureHoleString': '0'},
       'CL2': {'ApertureHoleString': '0'},
       'OL': {'ApertureHoleString': '0'},
       'SA': {'ApertureHoleString': '0'}},
      'Detector': {'DetectorKind': 'Test Camera Name 0',
       'Manufacturer': 'Test Vendor',
       'ModelCode': 'Test Camera Name 0',
       'ModelDisplayName': 'Test Camera Name 0',
       'PixelsPerMeter': {'Horizontal': 200000, 'Vertical': 200000},
       'ImagingArea': {'X': 256, 'Y': 128, 'Width': 512, 'Height': 512},
       'BinningSize': {'X': 2, 'Y': 2},
       'SoftwareCroppingArea': {'X': 0, 'Y': 0, 'Width': 512, 'Height': 512},
       'SoftwareBinningSize': {'X': 1, 'Y': 1},
       'ExposureTimeValue': 100,
       'FrameIntegration': 1},
      'ScanDataAcquisition': {'AcquiredFrames': 1},
      'Processings': [{'Parents': ['770ae6e5-119e-43e6-9430-54e26af2e1ca'],
        'ProcessType': 'ExtractSpectrum',
        'Parameters': [{'ExtractRoi': {'ShapeType': 'Rectangle',
           'Shape': {'X': 0, 'Y': 0, 'Width': 33, 'Height': 512}}}]}]}},
    'ViewInformation': {'Header': {'Version': '2.0.0',
      'ClumpId': '092084a4-e896-4118-bea5-90082f91a1d5'},
     'Tags': {}}}}]}
worksheet.get_clump_num_array_accessor
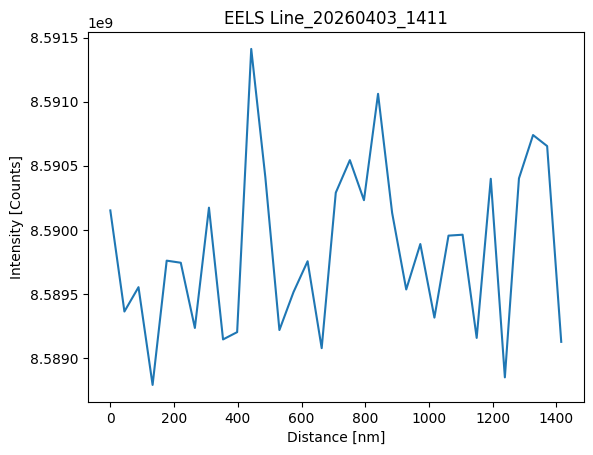
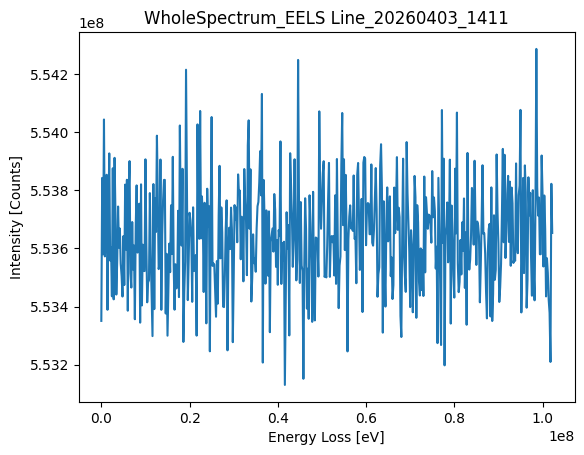
The following cells generate plots from graph_content1 (line-scan data) and graph_content2 (spectrum data) using these steps:
Retrieve the
ClumpIdviaget_data_setRetrieve
Dimensions/ElementTypeviaget_clump_num_arrayRetrieve the axis
Offset/Scale/UnitfromMeasurementInformation.CalibrationCoefficientsRetrieve the raw byte array via
get_clump_num_array_accessor, inferdtypefrom the byte count, and convert to a numpy arrayFor line-scan data: integrate over the spectral axis and plot as a distance profile (
Distance [nm])For spectrum data: build the energy axis (
Energy Loss [eV]) and plot withplt.plot
 1import numpy as np
 2import matplotlib.pyplot as plt
 3
 4# Get ClumpId from graph_content1 Children via get_data_set
 5dataset = worksheet.get_data_set(graph_content1['Children'][0]['Id'])
 6clump_id = dataset['Clump']['Id']
 7
 8# Get array dimensions and element type
 9array_info = worksheet.get_clump_num_array(clump_id)
10print('Dimensions:', array_info['Dimensions'])
11print('ElementType:', array_info['ElementType'])
12
13# Get spatial calibration (distance axis)
14calib = dataset['Clump']['Information']['MeasurementInformation']['CalibrationCoefficients'][0]
15offset = calib['Offset']
16scale = calib['Scale']
17unit_map = {'ElectronVolt': 'eV', 'Millielectronvolt': 'meV',
18            'Nanometer': 'nm', 'Angstrom': 'Å', 'Meter': 'm'}
19unit = unit_map.get(calib['Unit'], calib['Unit'])
20print(f"Calibration: offset={offset}, scale={scale}, unit={calib['Unit']}")
21
22# Get raw byte array and infer dtype from byte count
23raw_bytes = worksheet.get_clump_num_array_accessor(clump_id)
24total_elements = 1
25for d in array_info['Dimensions']:
26    total_elements *= d
27bytes_per_element = len(raw_bytes) // total_elements
28dtype_map = {1: np.uint8, 2: np.uint16, 4: np.float32, 8: np.float64}
29dtype = dtype_map.get(bytes_per_element, np.float32)
30narray = np.frombuffer(raw_bytes, dtype=dtype).reshape(array_info['Dimensions'])
31print('dtype:', dtype, '  shape:', narray.shape)
32
33# Squeeze singleton dims → (N_points, N_channels) or (N_points,)
34data = narray.squeeze()
35
36# Integrate over spectral (last) axis to get intensity per scan point
37if data.ndim >= 2:
38    profile = data.sum(axis=-1)
39else:
40    profile = data
41
42dist_axis = offset + scale * np.arange(len(profile))
43
44plt.figure()
45plt.plot(dist_axis, profile)
46plt.xlabel(f'Distance [{unit}]')
47plt.ylabel('Intensity [Counts]')
48plt.title(element['Title'])
49plt.show()
Dimensions: [1, 33, 512]
ElementType: Single
Calibration: offset=0, scale=44.2212586825585, unit=Nanometer
dtype: <class 'numpy.float32'>   shape: (1, 33, 512)
 1import numpy as np
 2import matplotlib.pyplot as plt
 3
 4# Get ClumpId from graph_content Children via get_data_set
 5dataset = worksheet.get_data_set(graph_content2['Children'][0]['Id'])
 6clump_id = dataset['Clump']['Id']
 7
 8# Get array dimensions and element type
 9array_info = worksheet.get_clump_num_array(clump_id)
10print('Dimensions:', array_info['Dimensions'])
11print('ElementType:', array_info['ElementType'])
12
13# Get calibration coefficients for energy axis
14calib = dataset['Clump']['Information']['MeasurementInformation']['CalibrationCoefficients'][0]
15offset = calib['Offset']
16scale = calib['Scale']
17unit_map = {'ElectronVolt': 'eV', 'Millielectronvolt': 'meV',
18            'Nanometer': 'nm', 'Angstrom': 'Å', 'Meter': 'm'}
19unit = unit_map.get(calib['Unit'], calib['Unit'])
20print(f"Calibration: offset={offset}, scale={scale}, unit={calib['Unit']}")
21
22# Get raw byte array and infer dtype from byte count
23raw_bytes = worksheet.get_clump_num_array_accessor(clump_id)
24total_elements = 1
25for d in array_info['Dimensions']:
26    total_elements *= d
27bytes_per_element = len(raw_bytes) // total_elements
28dtype_map = {1: np.uint8, 2: np.uint16, 4: np.float32, 8: np.float64}
29dtype = dtype_map.get(bytes_per_element, np.float32)
30narray = np.frombuffer(raw_bytes, dtype=dtype).reshape(array_info['Dimensions'])
31print('dtype:', dtype, '  shape:', narray.shape)
32
33# Build energy axis and plot spectrum
34spectrum = narray.ravel()
35energy_axis = offset + scale * np.arange(len(spectrum))
36
37plt.figure()
38plt.plot(energy_axis, spectrum)
39plt.xlabel(f'Energy Loss [{unit}]')
40plt.ylabel('Intensity [Counts]')
41plt.title(element['Title'])
42plt.show()
Dimensions: [1, 512]
ElementType: Double
Calibration: offset=0, scale=200000, unit=eV
dtype: <class 'numpy.float64'>   shape: (1, 512)
eels.set_calibration_result
Apply energy-axis calibration to the spectrum dataset (graph content).
Specify the dispersion and the first/second energy loss values in eV.
1calibration_param = {
2    'Dispersion': 2,
3    'FirstEnergyLoss': -512,
4    'SecondEnergyLoss': 510
5}
6eels.set_calibration_result(graph_content['Children'][0]['Id'], calibration_param)